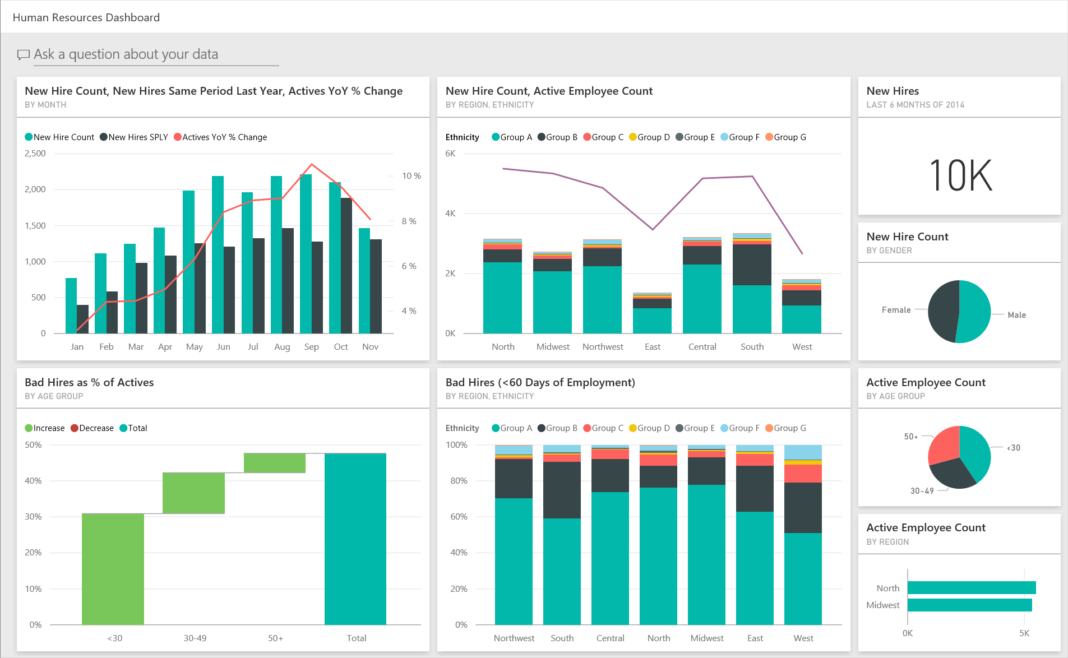
In today’s data-driven world, making sense of vast amounts of information is crucial for businesses. One powerful tool that can help with this is Power BI. This article will explore what a Power BI sample dashboard is, its importance, and how to create one that effectively visualizes your data.
What is Power BI?
Power BI is a business analytics tool developed by Microsoft. It allows users to create interactive reports and dashboards that make data easy to understand. With its user-friendly interface, Power BI can transform raw data into visual insights.
Why Use a Sample Dashboard in Power BI?
A sample dashboard in Power BI serves as a great starting point for anyone looking to visualize their data. Here are some benefits:
- Time-Saving: Sample dashboards save time by providing pre-built templates that can be easily customized to fit your needs.
- Better Understanding: They help users understand how to structure their data visually, making it easier to identify trends and patterns.
- Enhanced Collaboration: Dashboards can be shared with team members, allowing for better collaboration and data-driven decision-making.
Key Components of a Power BI Sample Dashboard
When creating a Power BI dashboard, certain components are essential for effective data visualization:
- Visualizations: These include charts, graphs, and maps that represent your data visually. Power BI offers various visualization options, such as bar charts, pie charts, and line graphs.
- Filters and Slicers: Filters allow users to narrow down data displayed on the dashboard. Slicers are visual filters that make it easy to segment data.
- Data Sources: Power BI can connect to multiple data sources, including Excel, SQL databases, and cloud services. Integrating various data sources can provide a more comprehensive view of your business.
- Layout and Design: A well-designed dashboard is visually appealing and easy to navigate. Pay attention to colors, fonts, and spacing to ensure clarity.
Steps to Create a Power BI Sample Dashboard
Creating a Power BI dashboard is a straightforward process. Here’s how you can do it:
- Choose Your Data: Select the data sources you want to use. This could be sales data, employee data, or any other relevant information.
- Import Data into Power BI: Use the Power BI desktop application to import your chosen data sources.
- Create Visualizations: Start adding visual elements to your dashboard. Use charts and graphs that best represent your data. For example, use a line graph to show sales trends over time.
- Add Filters and Slicers: Include filters to allow users to focus on specific data segments. For instance, you can add a date filter to show data for a particular month.
- Customize Layout: Arrange the visualizations in a logical order. Ensure that the most important information is easy to find.
- Share Your Dashboard: Once your dashboard is complete, you can publish it to the Power BI service. This allows you to share it with team members or stakeholders.
Best Practices for Power BI Dashboards
To ensure your Power BI dashboard is effective, consider the following best practices:
- Keep It Simple: Avoid clutter. Focus on displaying key metrics that matter most to your audience.
- Use Consistent Colors: Consistent color schemes help convey meaning and make the dashboard visually appealing.
- Update Regularly: Keep your data fresh by updating the dashboard regularly. This ensures that users always have access to the most current information.
- Gather Feedback: After sharing your dashboard, gather feedback from users. This can help you make necessary adjustments for improvement.
Conclusion
A Power BI sample dashboard is an invaluable tool for anyone looking to visualize data effectively. By following the steps outlined in this article, you can create a dashboard that not only looks good but also provides meaningful insights into your business. Remember to keep it simple, stay consistent, and regularly update your dashboard to ensure it remains a powerful asset for decision-making.
FAQs
1. What is a Power BI dashboard?
A Power BI dashboard is a single-page visual display of key metrics and data points created using Power BI.
2. How do I get started with Power BI?
To get started, download Power BI Desktop, choose your data sources, and begin creating visualizations.
3. Can I share my Power BI dashboard with others?
Yes, you can publish your dashboard to the Power BI service and share it with team members or stakeholders.
4. What types of data can I visualize with Power BI?
You can visualize various types of data, including sales data, employee performance, financial metrics, and more.
5. Are there free templates available for Power BI?
Yes, many websites offer free Power BI templates that you can use to get started on your dashboard.
With these insights and steps, you are now ready to embark on your journey of creating effective Power BI dashboards that drive informed decision-making in your organization!


